Recently i had to dig into a JVM thead wait/blocking/locking troubleshooting and i decided to write down my notes just for future reference for myself and for you!:)
Pre requirements to be known:
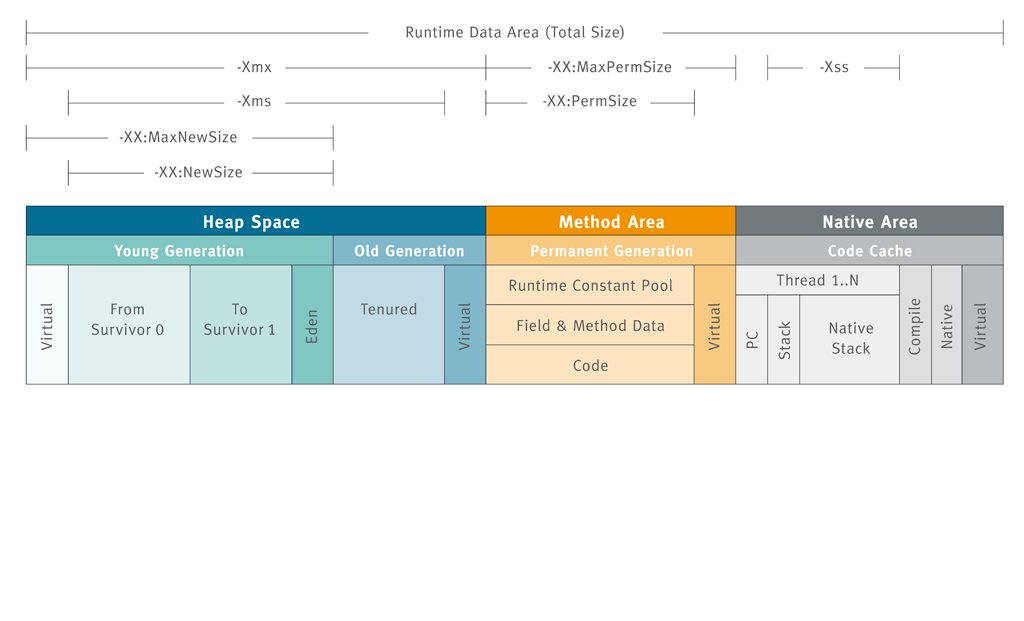
1. JVM Memory Space: This is divided to 3 following parts:
1.a Native Heap/Code Cache:
– Byte Code for JIT
– Native code which are already converted from Byte Code
– Mmap(Memory Map) files
1.b PermGen/Metaspace: Beginning from Java8, this area has no upper limit in order to avoid OutOfMemory errors. Operating System will use SWAP area(Virtual Memory) if the usafe goes beyond Physical Memory.
1.b.i. Size: This is defined my XX parameter
1.b.ii. Heap Structure: The following are stored under Metaspace:
- Class Definitions Metadata: Class Name, Object Arrays, Internal Object used by JVM, optimization information
- Static Member Variables (Variable itself / Object Reference)
1.c Heap: All runtime created stateless&stateful objects, app data, caches are stored in Heap.
1.c.i. Heap Size: Heap size is defined by two parameters:
- Xms(Initial Memory Allocation)
- Xmx(Maximum Memory Allocation)
1.c.ii. Heap Structure: Heap is divided into following spaces:
-
Young: Divided into 2 parts:
- Eden: First space used when the object is created.
- Survival: The objects which are survived from GC(Garbage Collection) are stored on so called S0/S1
- Tenured/OldGen: Objects reacted to max tenured threshold are moved to this space
Here is the model as a schema:
2. Footprint Requirement: This can be calculated considering the following formula:
- Number of ear, jar, war files that the single JVM process will handle
- Number of Java classes to be loaded during runtime
- Data cache(file, DB …) footprint
- Number of threads that are allowed to be created
Usually heap size 3-4 GB. is a starting point….
3. GC(Garbage Collection): Minimizing the GC frequency is a key factor for performance. Concurrent users and requests generate JVM GC HeartBeat. The frequency should be monitored.
4. Young vs Tenured: The typical ratio is 1/3, for example if you have 4 GB. Heap, 1GB for Young, 3GB for Tenured is expected. But this is totally depent to your business rules and traffic patterns.
5. Thread Dump Analyzer: There are various tools that you can use, the ones that i prefer are:
- https://spotify.github.io/threaddump-analyzer/
- http://fastthread.io/
Use XX:+HeapDumpOnOutOfMemoryError in order to create the Heap Dump in case of OutofMemory.
Here are the most popular focus areas that should be analyzed:
- Memory Leak
- Too many open files
- CPU usage
- Deadlocks
- ClassNotFoundException
- NoClassDefFoundError
As a last experience, there is an intersting jar which makes fullGC every 300 sec.:
https://github.com/jelastic-jps/payara/tree/master/payara-micro-cluster
That can be considered for non performance required applications….